Tools of the astronomers: spectroscopy


Until the detection of gravity waves in September 2015, the only information we had about the universe beyond the earth and moon came to us as electromagnetic waves: light, infrared, ultraviolet, radio waves, X-rays and gamma rays.
Other than visible light, we humans have had to slowly discover the existence of the other bands and build different detectors in order to explore the sky in each of them. Each band gives us different information about the universe and together have taught us much about objects stranger than earlier generations could even imagine.
Within each of the electromagnetic bands, we have also had to discover the information initially hidden. Once we break light into its spectrum of colors, its different wavelengths, we find that the universe is shouting to us about the nature and evolution of itself in a myriad of ways. In spectroscopy, the analysis of the spectra of stars and galaxies, astronomers have effectively learned to “mine” the light and other electromagnetic waves for hidden information and been rewarded with amazing discoveries.
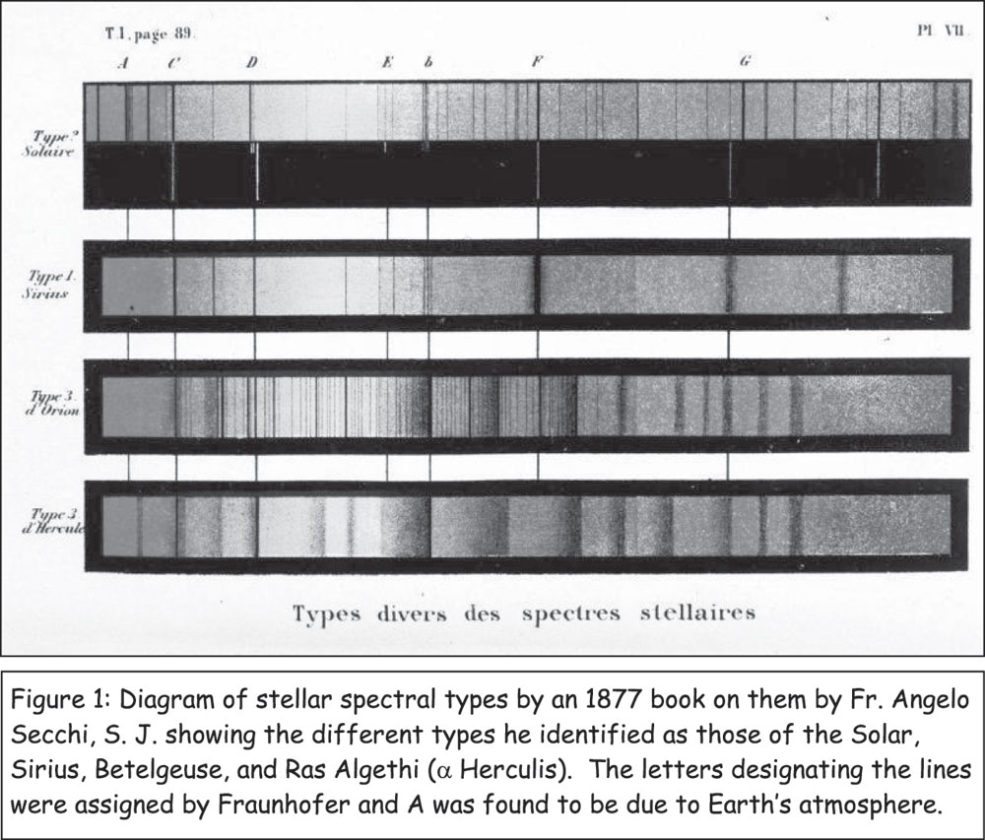
Isaac Newton made use of a prism to break light into the rainbow in his studies and Joseph von Fraunhofer, a Bavarian physicist and lens maker created the first spectroscope with very pure glass prisms and, later, diffraction gratings that are what we use now. These are thin plates etched with very fine lines (sometimes thousands per millimeter) that disperse reflected light into the spectrum just as a CD or DVD will reflect a rainbow. He noticed dark lines in the spectrum of the Sun and bright stars such as Betelgeuse and Sirius. In 1859, Gustav Kirchhoff and Robert Bunsen discovered that bright spectral lines in similar patterns were emitted by chemicals heated in the latter’s famous burner. In this, the composition of the Sun and stars was revealed.
As astronomers observed the spectra of stars, they noticed differences. Fr. Angelo Secchi, S.J. (1818 to 1878) was the director of the Observatory of the Roman College, an earlier incarnation of today’s Vatican Observatory. He started collecting stellar spectra in 1863 and classified them into five types, four of which are shown in Figure 1. I had the privilege of learning stellar spectral classification from Fr. Chris Corbally, S. J. during a sabbatical year with the Vatican Observatory Research Group in Tucson, Arizona, as it remains a very important astronomical tool.
After Secchi’s initial work, the greatest development of stellar spectroscopy was done by women at the Harvard College Observatory using spectra recorded on photographic plates. Williamina Fleming first classified spectra on the strength of the hydrogen absorption lines. Annie Jump Cannon classified about 350,000 stellar spectra. These were often little more than colorful smudges on photographic plates that she viewed through a reticle, calling out the classifications to an assistant. Some of the stars I classified were previously only classified by Cannon. Later, the relationships between stellar temperatures and the strength of the hydrogen lines rearranged the order of Fleming’s original classes to OBAFGKM. Cannon also introduced decimal divisions of these classes. In 1943, a group from Yerkes Observatory, Wilson Morgan, Philip Keenan and Edith Kellman, introduced luminosity classes ranging from dwarf (Roman Numeral V) to supergiant (I) based on the influence of a star’s surface gravity (a consequence of its size size) on the widths of the lines. Thus the spectra of stars were discovered to reveal not only their chemical compositions, but their surface temperatures and sizes! The Sun is a G2V star, a “normal dwarf” with a surface temperature of 5,800 K.
With these classifications, stellar spectra can now tell us the intrinsic brightness of stars from which we can calculate their distances by comparison to how bright they are in our sky. This method of determining distance is called “spectroscopic parallax.”
Other galaxies, however, are too distant to allow classification of individual stars. Cepheid variables and Type Ia supernovae allow distances to be determined for some galaxies, but it remains difficult to accurately determine the distances to most galaxies.
The default estimate of the distances to galaxies is the Hubble Law. Edwin Hubble discovered that (almost) all galaxy spectra are redshifted, indicating they’re moving away from us. He further discovered that the amount of redshift increases with galaxy distance. The simplest interpretation of these two facts is that the universe is expanding, that is, the space between the galaxies is getting bigger. For a galaxy at a given distance from us and another that is twice as far, if all the distances double, the near one will be at double the distance, but the more distant one will be four times farther … so it had to move away from us at double the speed of the near one. Much work has gone into our measurements of the expansion rate, known as the Hubble Constant, H0 (H-naught) and a first approximation of any galaxy’s distance is the Hubble Law. Since H0 is the slope of the velocity vs. distance line, the distance is simply H0/v, the Hubble Constant divided by the galaxy’s velocity determined by the redshift. Unfortunately for the galaxies I observe that are generally in gravitationally bound clusters, their velocities are not just due to the expansion of the universe so the Hubble Law will only give us a first guess at the distances.
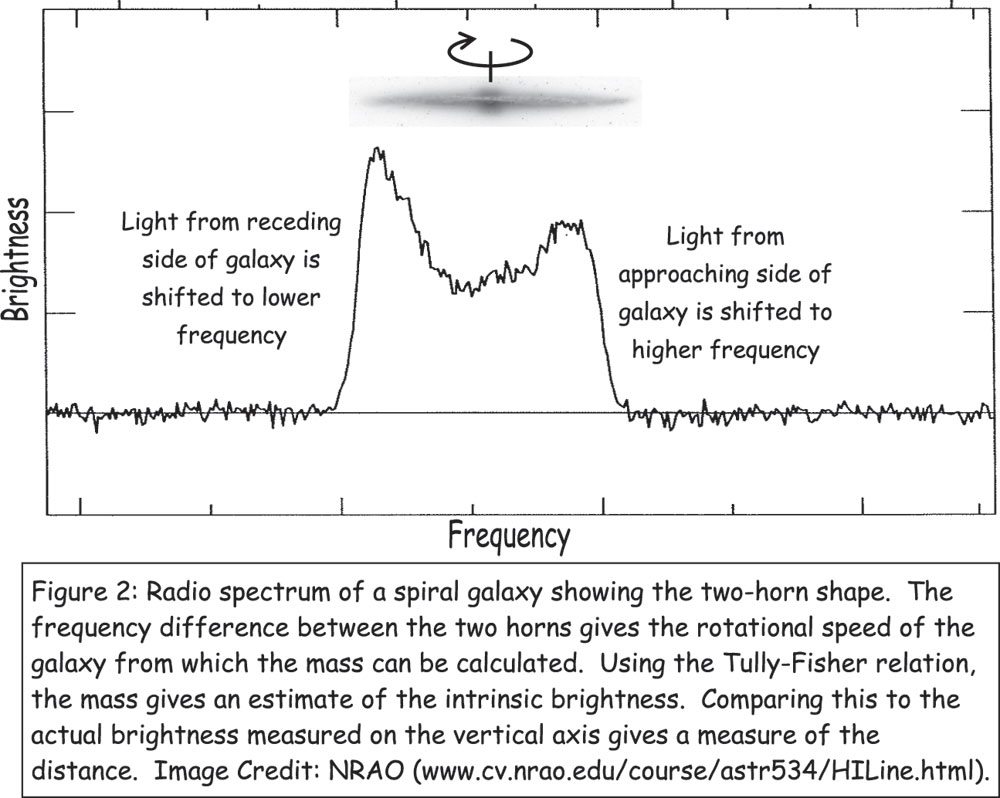
A different distance measure for galaxies was first introduced in 1977 by astronomers Brent Tully and J. Richard Fisher. In the Tully-Fisher Relation the rotational speed of a spiral galaxy is used as a measure of its intrinsic brightness. The spectra of spiral galaxies seen edge-on show a “double horn” structure as shown in Figure 2. This is due to the fact that one side of the galaxy is approaching us, causing the emitted radio waves to be shifted to the blue, a higher frequency like an approaching siren shifted to a higher pitch. The other side that is moving away, is shifted toward the red, a lower frequency like a receding siren at a lower pitch. Think of the sound of passing racecars … or get a kid to imitate the sound of a NASCAR race … to compare the frequency change as they pass. Using Newton’s laws of dynamics, we can calculate the mass of the galaxy from the rotation rate. From the galaxy’s mass, we can estimate its intrinsic brightness and calculate the distance. Of course, this works best for edge-on spiral galaxies and most aren’t exactly edge-on, so there’s always a bit of a fudge-factor in our distance estimates.
Fudged distances or not, the astronomers of the Adirondack Public Observatory invite you to enjoy viewing the wonders of the cosmos at our Roll Off Roof Observatory (RORO) that is open to the public on the first and third Fridays of each month approximately one half-hour after sunset. Please come and view through our telescopes and learn about the Wilderness Above. For updates and notices, check out our website at adirondackpublicobservatory.org and our Facebook page. On our public observing days you can also call the RORO at 518-359-6317 to talk with one of our astronomers.
Columns

5W Wednesdays, from Historic Saranac Lake

Loony for loons
Just a hoot
Hooters filed for Chapter 11 Bankruptcy protection this past spring. You know, the chain famous for its scantily ...
Quebec considering lowering BAC limit from .08 to .05
Quebec is considering lowering the legal blood alcohol concentration (BAC) limit for drivers to 0.05% from the ...

Summer is Time for Peas!
Picnic and barbecue safety
With summer here, I find myself getting grilled by families asking about safety precautions they should be taking ...